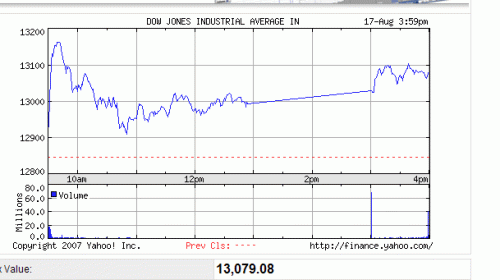
This is Friday’s DJIA chart. I just happened to notice it this weekend as I was poking around the Yahoo Finance area.
Now I’m no financial guru by any means. I’m no day-trader and I certainly do not claim to be an expert on the machinations of the Wall Street elite. However, even I look at this chart and wonder how the hell something as volatile and “chaotic” as the minute by minute fluctuations of the world’s largest stock market could produce a near linear growth for nearly 2 hours.
It seems to me that if trading were suspended during that time, one would expect to see a plateau of sorts. But a perfectly linear progression of millions upon millions of stocks being bought and sold by literally millions upon millions of different people? Bueller? Bueller? Anyone??

